|
 Manual
(Adobe Acrobat pdf) Manual
(Adobe Acrobat pdf)
 Demo
version setup files (.zip). Extract files and run setup.exe Demo
version setup files (.zip). Extract files and run setup.exe
 Description (click
on images for full size image) Description (click
on images for full size image)
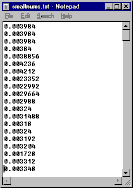
The Area program takes in a
ascii file of numbers similiar to the one below.

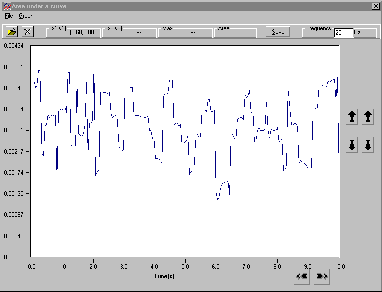
The program is designed for use with academic experiments and it is assumed the readings are taken at a certain frequency.
This may be set in the main graph screen as shown, and the time axis is adjusted automatically. The graph shows 200 points at a time but the graph may be compressed or extended by changing the default setting.

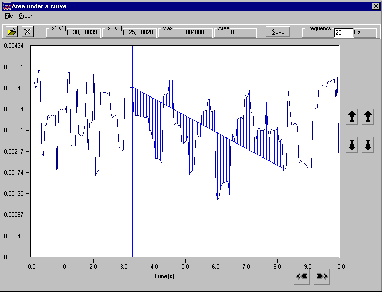
As the mouse moves over the graph a vertical line moves with it. Clicking on the graph sets this line and clicking a second time sets the second delimiter. Once the
area to be measured is set the readings are taken and displayed in the top title bar as shown.

The user may then 'save' this reading into a grid.When readings from the whole file have been taken the data in the grid may be saved as a '.csv' file which can be opened directly into Excel for further analysis.
|

